Question 530Electricity & Electronics - Assistant Engineer
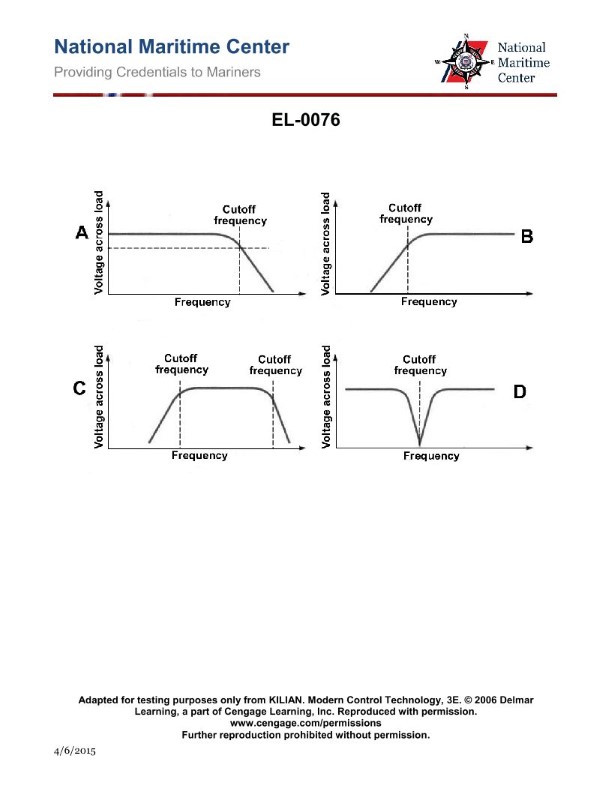
70% to passIn referring to the graphs shown in the illustration, which of the following figures represents a bandpass filter? Illustration EL-0076
AA
BB
CC
DD
AI Explanation
The correct answer is C. The graph labeled C in the illustration represents a bandpass filter. A bandpass filter is a type of filter that allows signals within a certain frequency range to pass through while attenuating signals outside that range. This is the defining characteristic of a bandpass filter, and the graph in option C clearly shows this frequency-selective behavior. The other options do not depict a bandpass filter. Option A shows a lowpass filter, Option B shows a highpass filter, and Option D shows a notch filter, which is a different type of frequency-selective filter.
Related Questions
Q216:A split-phase induction squirrel-cage motor will not start and come up to speed,...
Q272:When a fluorescent lamp has reached the end of its useful life, it should be rep...
Q561:What type of electric propulsion system converter is shown in the illustration? ...
Q388:In the diagram of the switchboard shown in the illustration, what is the functio...
Q64:Which of the following figures shown in the illustration represents incandescent...
Ready to test your knowledge?
Take a Electricity & Electronics - Assistant Engineer Practice ExamOfficial Resources
Pass Your Coast Guard Licensing Exams!
Study offline, track your progress, and simulate real exams with the Coast Guard Exams app